
2016 has started off with a proverbial bang in the U.S. and world wide stock markets. It is no exaggeration to state that the stock market performance for January so far makes this the worst opening month of any trading year ever. European and Japanese stock markets are in or nearing bear market territory already, and the U.S. stock markets have passed the point of official correction so far with no real letup or end in sight. There are observers watching who have chuckled to themselves and remarked that of course we are down now; since we just experienced a six year long bull market without any meaningful correction, it was inevitable. You could say the writing was on the wall. In truth though, out of 17 major Wall Street analysts/strategists who were surveyed at the beginning of the year 2015, all of them believed that the stock market would end the year higher than it started. Reality was a little crueler, as the Dow Jones finished down by 2.23%. It is already down far more than that so far for the first three weeks of January. It is not true that no one at all saw it coming. The Elliott Wave Theory had some interesting projections to offer for the stock market back when all of the other voices out there said that the rosy picture in the markets would only continue going forward.
In fact, Elliott Wave was pointing to a well-defined top back when everyone else was busy toasting their present and future successes. Back in November of 2015, Elliott Wave started shouting warning signs to the crowded room of analysts, yet no one much seemed to be listening no matter how loudly it cried “watch out.” The warning signs were everywhere. They started with highly divided stock markets in the U.S. The major secondary American stock market indices were all warning that everything was not well in endless rally land. In fact, the Russell 2000 Index, the S&P Mid Cap Index, the S&P Small Cap Index, and the Value Line Index all had already entered a bear market even while the S&P 500, Dow Jones, and NASDAQ indices continued their unjustified rally well into October. Meanwhile, the Russell 2000 Index, actually a far more telltale measure of the economic health of the overall U.S. economy than the blue chip majors are, had topped out in June of 2007, as had the Dow Transports and Value Line Indices that had peaked back in July of 2007. As Elliott Wave Theory is quick to point out, such divergent trends between the various major stock markets are anything but healthy indicators of continuing bull markets. Rather, the widening fissure represents warning signs of a major trend that is tired and in the throws of expiration.
What Did Dow Theory, the Father of Elliott Wave, Have to Say About the Markets?
Before Elliott invented his now famous Wave Theory, Dow Theory stood as the earlier predecessor to the now legendary Elliott Wave school of thought. Dow Theory showed that the Dow Jones Transportation Average was lagging dangerously behind the rest of the Dow Jones indices. This is because the composite members of the Dow Jones Transports are far more sensitive to and are leading indicators of real economic conditions in the U.S. Back in September, the Elliott Wave Financial Forecast brought up a serious bear market signal from the Dow Theory that appeared in late August. At this critical point, both the Transports and the Industrials actually closed under their October 2014 point closing lows. It was not a glorious day in Dow Theory, and this bear market indicating signal is still solidly intact to this day over a year later.
Should the Dow Industrials manage to set a new high without the Dow Transports coming along for the ride, then the bearish signal would still be in effect and full force. In fact, this would cause the bear market indicator to be even stronger. While many analysts have dismissed the grandfather Dow Theory as old and outdated, they are neglecting to mention that the two largest bear markets from the last 40 years both began in conjunction with Dow Theory bear market warning signals. Recall that in both of the years 1973 and 2007, non confirmation arose between the Transports and the Industrials forecast signals which then led to major declines in the markets that finally reached an eye watering 45% and 54% drops. The present signal shows that the Dow Jones Transportation Averages are off 24% from the closing high made on December 29, 2014. As if this is not bad enough, the Dow Jones Transportation Index recently turned in the very worst yearly performance in 100 years, since 1917, in a year when no official or even conjectured recession existed. That does not bode well for the future days of the stock market, as per the Dow Theory and Elliott Wave Theory.
The Elliott Wave Financial Forecast Warning
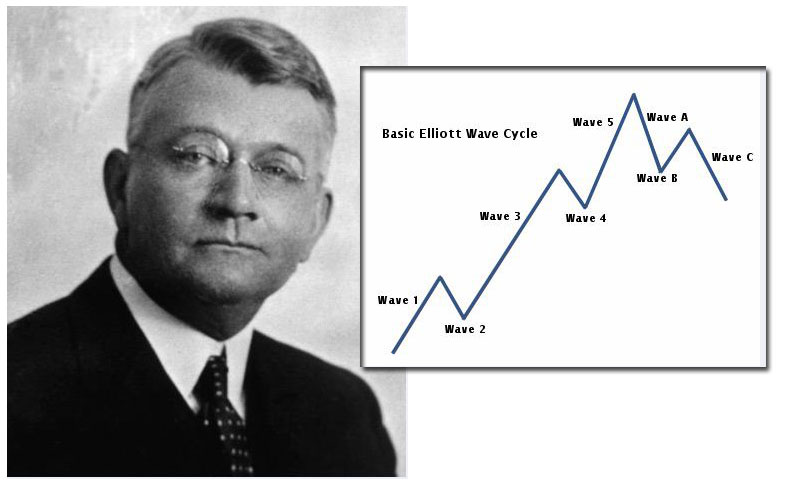
In December of 2015, the Elliott Wave Financial Forecast gave additional warnings. The analysis of its signals warned that the stock market was still splintered. On one particularly bad Thursday sell off in December, 87% of all S&P 500 stocks declined. The warning was that this kind of downside volume and breadth was expanding and would only increase the bearish potential of the stock markets. That same month, the founder of the Dow Theory himself pointed out that his PTI indicator and 90 day moving average showed that the upside was exhausted as the Elliott Wave Financial Forecast had been demonstrating for several months already. This indicator peaked on July 1, 2014 a year and a half before and since had made a number of lower highs as the market rose on into May. This proved that a serious loss of upside energy and focus had already occurred. Stock market tops happen when the momentum erodes away one index at a time and the indices throw in the towel one by one. Even though blue chips continued to reach towards new highs, these disparities with the other indices showed an upside price change that was consistent with a fifth wave in the Elliott Wave Theory cycles.
Sure enough, the cold hard reality has begun to work on the stock market blue chip indices as well. At the lows on Wednesday, January 20th, the Dow Jones Industrial Average itself had fallen by a shocking 557 points without any bad news to explain the plunge. The S&P 500 was simultaneously nearly at its October of 2014 low, per CNBC. That same day, European markets took a swan dive off a cliff to the calamitous tune of 3%. Japan’s stock market main index the Nikkei also tripped across the threshold for bear market on that same day. To say that Elliott Wave Theory finally caught up with the major stock market indices around the U.S. and the world would be a little obvious.
Elliott Wave and Its Dow Theory Predecessor Concur on a Major Move Down in Stocks


- Using Counting Fractals to Find Elliott Waves - May 19, 2016
- The Grand Supercycle Controversy - May 19, 2016
- Robert Prechter’s Enduring Impact on Elliott Wave Theory - May 12, 2016
- Elliott Wave Gold Review - April 29, 2016
- Common Objections to Elliott Wave Theory - April 28, 2016
- What Are Elliott Wave Theory’s Waves Within Waves About? - March 8, 2016
- Review of the New Classic Among The Elliott Wave Theory Books, “The Elliott Wave Principle” - February 25, 2016
- Reviews of 2 Classic Elliott Wave Theory Books - February 25, 2016
- The Origins of Elliott Wave Theory and How it Was Discovered - February 13, 2016
- Elliott Wave Stock Market Review - February 5, 2016