Technical analysis, including Elliot wave theory, depends on numerical relationships and interactions. Understanding the underlying patterns allows you as a trader to make bigger and more consistent gains. That is key to doing well, especially the second part- the more you know about where the market or an asset will move, the better you do at taking and holding profits. Specifically, having a price target in mind where a trade will be a good move helps you decide whether to stick with a position or ditch it. On the opposite end, you need a stop price to show you when to cut and run. In this article, we will discuss how Fibonacci numbers might help illustrate and predict the motions of waves as Elliot understood them, and whether it is a good idea to try using Fibonacci sequences to predict wave sizes.
The Fibonacci Sequence

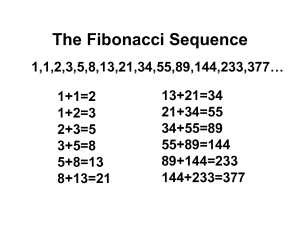
The sequence starts with a zero followed by a one. The next number is just the sum of the previous two numbers.
The Fibonacci sequence is a sequence of numbers in mathematical theory that Western academics first found in the 13th century the notebooks of an Italian named Fibonacci, although it had been discovered elsewhere in the world. The idea is quite simple. The sequence starts with a zero followed by a one. The next number is just the sum of the previous two numbers. So the first few numbers in the basic sequence are 0, 1, 1, 2, 3, 5, 8… and it goes on in the same pattern forever. That is the most basic form of the sequence. There is also a more complex form that uses the Golden Ratio to find fractional numbers that follow the same pattern. It is this more complex form of the Fibonacci sequence that is more useful for asset price prediction.
The main reason to focus any attention on the Fibonacci sequence is because it appears very frequently in nature. There are many examples of the Golden Rule and the Fibonacci sequence dictating the actions of plants and animals. For example, the spirals in the shells of snails and the webs of spiders all mathematically conform to the Fibonacci sequence.
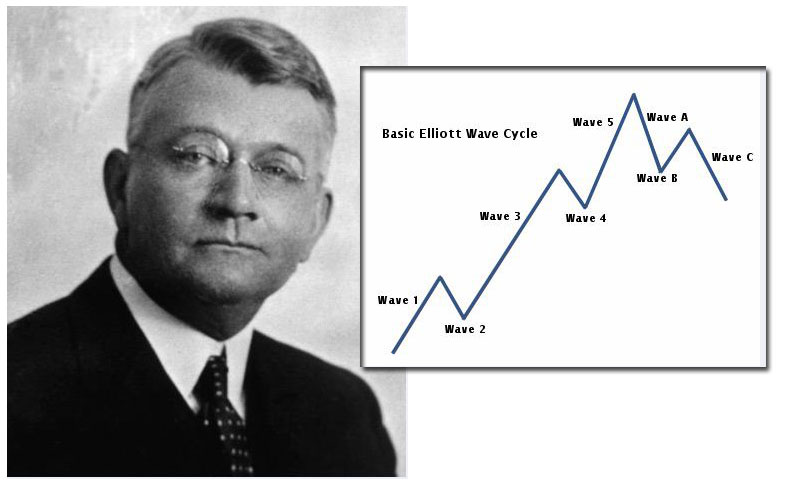
Recall the importance that Elliot wave theory places on human psychology. If the waves we see in asset prices really are due to the cycles of optimism and pessimism in human nature, then it seems possible that the Fibonacci sequence could play a role in the size of wave movements. That is why some technical analysts link the sequence to wave analysis. The idea is that tracking the waves is enough to tell you the direction of asset price movements, and then adding in the sequence provides more detailed information about the size of those shifts, because the movements should conform to the sequence.
The Evaluation: Pros and Cons
If this concept is a valid way of describing the markets, then it could be very powerful: you would be able to go into any wave with a good idea of how far it is likely to move. However, there are a few things to consider before buying into the idea. First of all, think about the theory behind this idea. The Fibonacci sequence is successful at describing the way individual plants and animals behave in some contexts- that is true. But there is not much evidence of it successfully describing human behavior. The examples of the sequence in nature generally relate to physical structures, such as the number of petals in flowers. Animals and plants need to be consistent in order to survive- spiders need to be able to make their webs correctly every time, so it is not surprising that a common pattern emerges from that activity. Going a step further to say that people’s internal thought patterns also somehow conform to the sequence as applied to asset prices is a much bigger leap. It is hard to imagine how that would work from a psychological perspective. That is not to say that it does not happen, but it is complex and specific enough to warrant a lot of study, and so far the evidence is lacking.
Next, another big problem is that this theory makes predictions about the collective actions of the market participants. That makes sense when it comes to waves, but it seems unlikely that all of the buying and selling by traders would lead to numbers that just happen to correspond to the sequence. Taking into account that the psychological evidence for the Fibonacci sequence being meaningful to human actions is lacking, there is no mechanism for why the collective actions of traders would therefore create movements in line with the sequence. Remember that the sequence sometimes predicts the actions of individual plants and animals- not groups.
Does It Work?
Considering the above discussion, it is more likely that people who see the Fibonacci sequence in asset price movements are falling victim to confirmation bias. This is a mental error in which people block out results that do not go along with their theory and accept results that do. So people forget about the times the price did not conform to the sequence, and then it seems as if the theory does very well. Without a better understanding of the mechanism by which the Fibonacci sequence is linked to wave movements, and some solid evidence for how it works, it is hard to recommend following this idea. Again, this is not to say that the idea is certainly false. It is just that the lack of evidence for it makes it difficult to recommend in a trading environment. You can certainly try it out and see how it works for you.
- Elliott Wave and Fibonacci Relationships: are they real? - December 7, 2015
- Elliott Wave International Review - November 23, 2015
- What is the Elliott Wave Theory/Principle? - November 22, 2015
- The Elliott Wave Principle and Gold - November 18, 2015
- The Elliott Wave Principle in Forex Trading - November 18, 2015
- Elliott Wave DNA Review - November 16, 2015
- Elliott Wave and the S&P - November 16, 2015


