
There are two broad forms of investment strategy: fundamental analysis and technical analysis. Fundamental analysis focuses on the performance of the underlying companies or assets, and technical analysis uses graphs and mathematics to predict movements in stock prices. In this post, we’ll focus on a critical part of technical analysis called Elliot waves. The Elliot Wave Theory (also known as the Elliott Wave Principle) is a guiding principle of technical analysts, both professional and amateur, and it is an important topic for anyone who wants to try technical analysis on their own.
Introduction to Elliot Waves
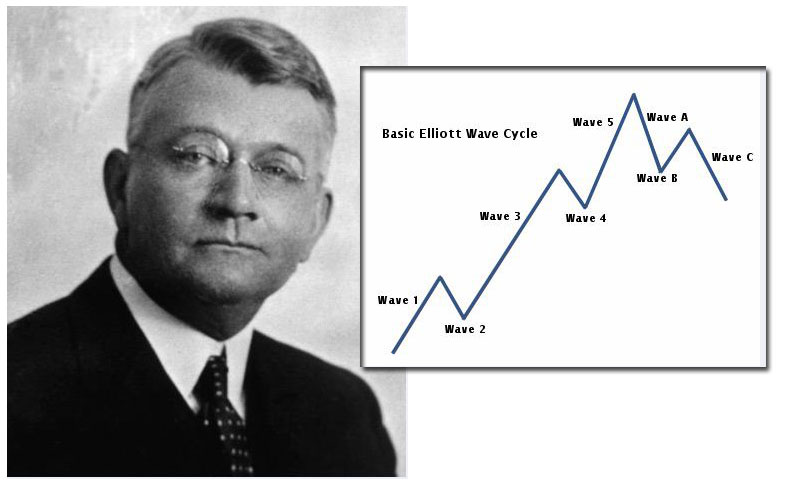
The “Elliot” in Elliot waves was Ralph Elliot, an investor and accountant who lived from 1871 to 1948. Elliot developed a theory to predict the movements of asset prices based on what he believed were fundamental facts about human nature. Elliot observed that asset prices do not move in smooth lines- they tend to jump up and down in movements that appear regular. Elliot hypothesized that the waves were driven by fundamental cycles of optimism and pessimism among the traders working in the market. He reasoned that because these cycles were a basic part of human nature, the waves they generated would therefore be predictable. Therefore, by understanding the current situation in the market, technical analysts could identify the next waves to occur and prepare themselves accordingly.
The Elliot Wave Principle and the S&P 500
To be specific, the Elliot wave theory makes predictions about the nature and size of every type of wave and how they generate or change the overall trend of the market. In the stock market, the best aggregate measure of the performance of the market as a whole is through one of the main indices. One of the most popular such indices is the Standard and Poor’s 500, which is based simply on the stock price of the 500 largest companies in the stock market. It is a broad measure of the performance of the stock market. When it comes to waves, each wave has its own innate characteristics. For example, imagine a bear market at the cusp of ending. The first wave would be a move upward in the value of the index that would appear to contradict fundamentals. The second wave is a shift downwards again that damages faith in the rally. The third wave is a strong upward movement in the index accompanied by a recovery in fundamentals. The fourth wave is another small drop that pulls back some of the gains of wave 3. The fifth wave is a final smaller increase in prices that signifies the bull market is coming to an end. After those five major waves, there are three lettered waves- A, B, and C- that introduce the new bear market, and the cycle repeats itself for the new bear market.
Using Wave Theory in the S&P
The structured nature of the waves suggests some obvious applications. Technical analysts who track the market through the S&P and know which phase of the cycle it is in will be able to predict the next several movements in the price level. They can then execute trades that use this information to make a profit by, for example, buying just before wave 3 hits in a bull market or selling as the corrective waves begin. Applying wave theory requires careful timing, because waves tend to alternate. Getting the wrong entry point for a position will lead to losses instead of profits. It takes a considerable amount of time for someone to learn how to read where a market is in a wave cycle and how to act on that knowledge.
There are also wave cycles of different lengths. The S&P goes through waves over the course of a day and waves over the course of a year. Depending on your individual risk preferences and your goals for your portfolio, you will want to look at cycles of waves that have short, medium, or long-term implications. Each of those viewpoints will provide you with technical insights into how to achieve your investing goals.
What To Do Next
The information in this post was intended to be an introduction to the ideas behind Elliot wave theory, which is a specific application of technical analysis. If you find this idea compelling like so many other traders, then you need to learn more. Web resources can teach you all you need to know about wave theory and Elliot’s theory. There is some question about whether the same patterns that Elliot identified still hold today. After all, the original idea was that the wave pattern came from natural rises and falls in investor confidence. Could it be possible that investors and our culture have changed enough that the old approach needs updating? Investors might not have the same pattern of confidence cycles even if they do all feel similar sentiments at the same time. Some contemporary traders have tried to modify the Elliot patterns and see if there is a better fit than the original results. The jury is still out on that point. But if you believe in technical analysis, then it is hard to reject Elliot waves as a serious contribution to trading theory.
- Elliott Wave and Fibonacci Relationships: are they real? - December 7, 2015
- Elliott Wave International Review - November 23, 2015
- What is the Elliott Wave Theory/Principle? - November 22, 2015
- The Elliott Wave Principle and Gold - November 18, 2015
- The Elliott Wave Principle in Forex Trading - November 18, 2015
- Elliott Wave DNA Review - November 16, 2015
- Elliott Wave and the S&P - November 16, 2015